|
Race morning (Oct. 7th) is 11 days away. This is pretty far out for a trustworthy forecast of temperature and weather, but it's close enough in time we can start to get an idea of the overall weather pattern. There are a number of ways we can try to peek into the future that far out. Today, we'll look at a forecast tool known as a forecast ensemble to judge how well a numerical weather prediction model is handling its weather patterns. As we'll see, race day is shaping up to be a difficult forecast but we at least are starting to get an idea of the weather pattern that's setting up on race weekend. So please read on to learn more about how to use an ensemble to get useful weather information at longer range. And if you skip far enough ahead, we'll look at how race day is shaping up. I am happy to answer questions in the comments below. Before getting into the forecast, I will try to explain here how an ensemble works. A forecast ensemble is just a forecast model that is run a few times at each forecast time. For example, this morning NOAA ran its GFS ensemble with 20 forecast members out to 384 hours, as it does four times a day. That is, four times a day, 20 predictions are made with the GFS model. Each of these forecast members are made unique by adding small, unique perturbations to the initial conditions of each of the ensemble forecast members. An ensemble is intended to show the amount of uncertainty in a forecast since the small initial perturbations grow larger in time and space as a model is run (typically on a supercomputer) forward in time. So, for an 11-day ensemble forecast, if we see that all of the ensemble members generate a huge range of weather possibilities, we know making a specific forecast isn't very useful. If the ensemble members, on the other hand, sort of resemble each other, or at least show some kind of narrowed range of weather pattern possibilities, then we can get useful information. As a caveat, it is worth mentioning ensembles suffer from what is called "underdispersion", where the range of predicted possibilities is too small (i.e., too confident) and not consistent with the actual model errors. I won't get into this issue too deeply, but it's a way that ensembles can fool a forecaster. For now, we'll just use an ensemble to see if there's some kind of pattern emerging. To keep this post from getting too long, I'll pick on the American ensemble system today. But I will include other ensemble systems into future blog posts since incorporating variety leads to a more accurate forecast. Below we have a "spagetti plot" of the so-called 500-hPa geopotential height fields contoured at three values (5520/blue, 5760/green, and 5880/red gpm) for all of the ensemble members of the GFS forecast model (GEFS) on Sunday morning (Plot credit: COD Weather at http://weather.cod.edu/forecast/ ). 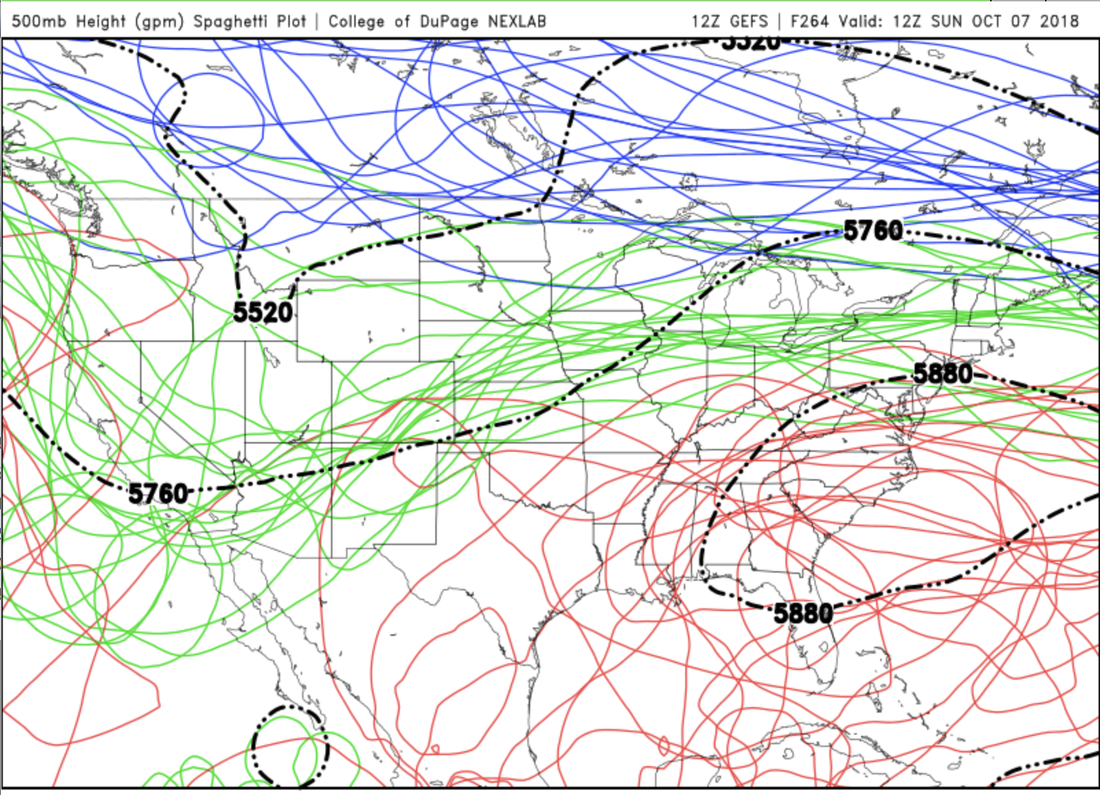 500-hPa is a pressure level (pressure decreases with height) representing a slice of atmosphere at around 18,000 feet above sea level. It's a good level to discern large-scale weather patterns. To bring this plot down to earth, the green curves are rough approximations of where the jet stream is positioned in each ensemble forecast member, and the black curve is the non-ensemble version of the GFS. Typically, it is cooler north of the jet, whereas it is warmer south of the jet. Low pressure systems often move along and with the jet. At first glance, this plot does resemble spagetti and seems like a giant mess. But actually, if you cross your eyes, you can see the colored lines sort of cluster together. The jet (green lines) seems to dip south over the Rockies and head north over the Great Lakes at this time. This suggests the potential for warmer than normal conditions over the eastern third of the country, and cooler air moving in over the Dakotas. This puts Minneapolis right in the battle zone. And just looking at this chart alone, it seems plausible a low pressure system might be positioned somewhere over the Great Plains during this time. So, while the pattern looks fairly well parsed out, being in the region of the jet makes this a challenging forecast for Minneapolis, since any one of those green lines can mean profoundly different conditions on race day. This means there could be a cold front to the west of Minneapolis with brisk, warm winds out of the south or that a cold front might have already passed by the starting gun with refreshing, cool winds out of the northwest. Alternatively, a low pressure system may sit to the southwest, with a warm front in the area, accompanied by the potential for some rain and thunder. Some of these possibilities sound concerning, but given the wide range of possibilities at this point, it's hard to bank on any given scenario. We only know that a pattern is emerging with a storm system and accompanying cold front setting up somewhere over the central US. There exists pitfalls and silver linings in any of the scenarios for the marathoner to consider. One other thing to consider with these ensembles is weather extremes. I'd put those red lines in the category of extreme. If those lines were close to Minneapolis, that would mean very warm weather might be possible. The good news for now is those red lines are quite a bit south, so even if the cold front hasn't passed on Sunday morning, a reasonable estimate of the upper bound on temperatures is in the 60s to maybe 70s. And again, it would likely be refreshingly breezy in that case since the pattern suggests a storm system happening somewhere in the central US. Likewise, January weather looks unlikely, although cool weather cannot be ruled out. I will not get into precipitation/thunder specifics until later forecasts since that's even harder to predict than the large-scale weather pattern. Finally, to repeat the earlier caveat about underdispersion, we can get too confident that the pattern will occur as predicted in the above GFS ensemble, but it's quite possible the forecast members are latching onto a certain pattern whereas other patterns are more likely than shown above. This is a frustrating aspect of ensembles, but at least they start to show the range of uncertainty you can't get from just looking at a single forecast. And hopefully help you plan for race day scenarios that may occur. I will provide updates in the coming days as the forecast picture becomes clearer, but for now, I'll leave you with the Climate Prediction Center's probabilistic outlook for temperatures in the coming 8-14 days. It's no coincidence it resembles the GFS ensemble above. It shows Minneapolis on the edge of likely cooler than normal weather, consistent with a cold front sweeping southeastward out of Canada in the 8-14 day timeframe. So let's hope it is ambitious and gets there in time for race day! -Chris 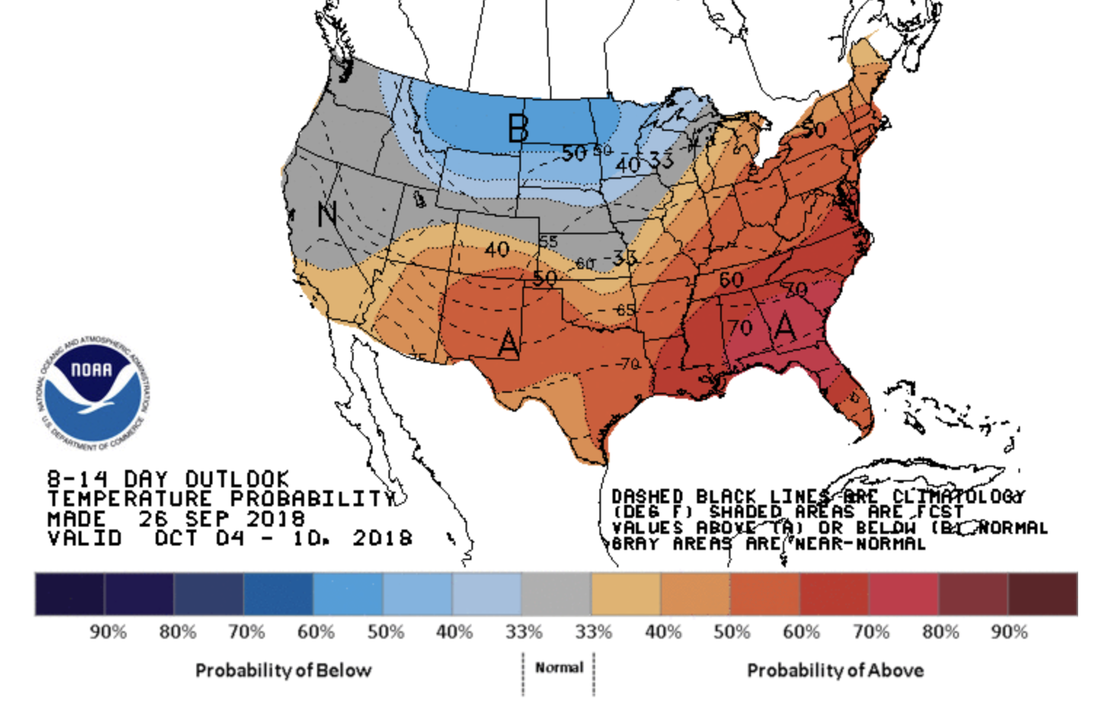
0 Comments
Leave a Reply. |
Chris Rozoff and Jesse Sweeney, content contributors.Chris is the expert meteorologist and MVP. Jesse is someone who watched the weather channel a lot as a child and breaks it down for the masses. Chris runs ultras. Jesse runs road and ultras. Archives
April 2019
Categories |
 RSS Feed